- why the normal distribution is so popular
- how fat the tails really are
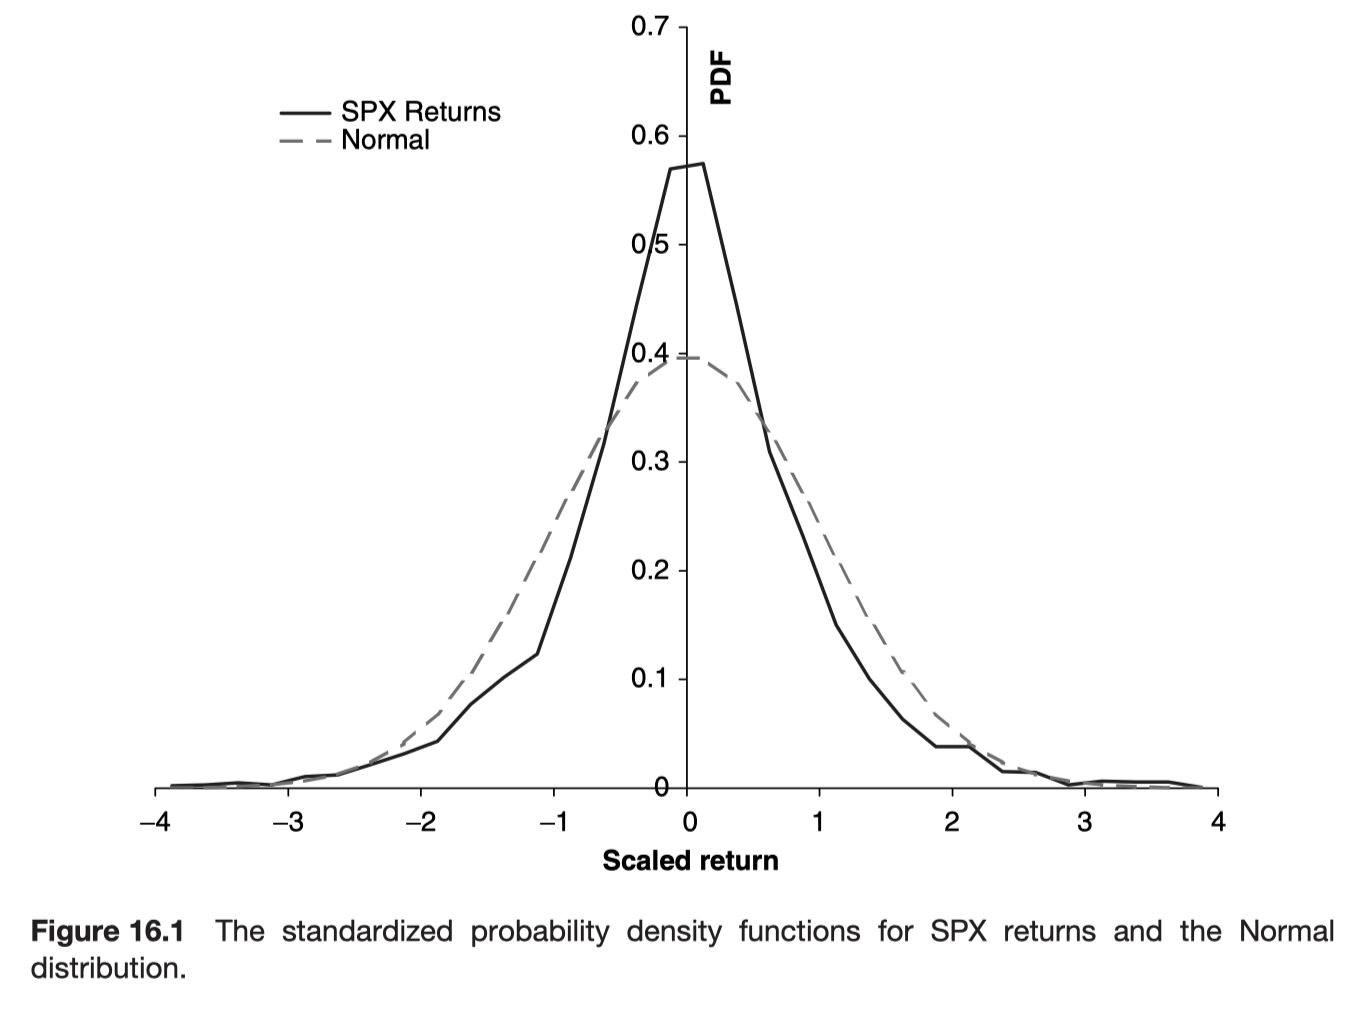
- what dropping the normal assumption entails
Introduction
The normal distribution allows us to make enormous advances because it comes with a lot of relatively easy-to-use analytical tools. However, the normal distribution vastly underestimates stock crashes probability.
Why we like the normal distribution: the central limit theorem
The central limit theorem (CLT) states: ’Given a distribution with a mean m and variance \(s^2\), the sampling distribution of the mean approaches a normal distribution with a mean of m and a variance of \(s^2 / N\) as N increases.
By ‘sampling distribution of the mean’ is meant
\[ \frac{1}{N}\sum_{i = 1}^N{X_i} \]
where the \(X_i\) are all drawn from the initial distribution.
Perhaps stock price daily returns should be normal since you ‘add up’ thousands of returns during each day.
And since the normal distribution only has the 2 parameters, the mean and the variance, it follows that the skew and kurtosis etc. of the building-block distribution don’t much matter to the final distribution.
The conditions under the central limit theorem is valid.
- The building-block distributions must be identical (you aren’t allowed to draw from different distributions each time)
- Each draw from the building-block distribution must be independent from other draws
- The mean and standard deviation of the building-block distribution must both be finite
Normal versus lognormal
Lognormality that relies only on the Central limit theorem
\[ S_1 = S_0(1 + R_1) \]
\[ S_2 = S_0(1 + R_1)(1 + R_2) \]
\[ S_N = S_0 \prod_{i = 1}^N{(1 + R_i)} \]
The stock price \(S_N\) is lognormal distributed according to the Central Limit Theorem.
\[ \log{S_N} = \log{S_0} + \sum_{i = 1}^N{\log{(1 + R_i)}} \]
Since \(R_i\) is random, it follows that \(\log{(1 + R_i)}\) is random, so here we are adding up many random numbers. If the \(R_i\)s are all drawn from the same distribution (and the other conditions for the CLT hold) and N is large, then this sum is approximately normal. And that’s what lognrmal means. A random variable is lognormally distributed if the logarithm of it is normally distributed.
Does my talk look fat in this?
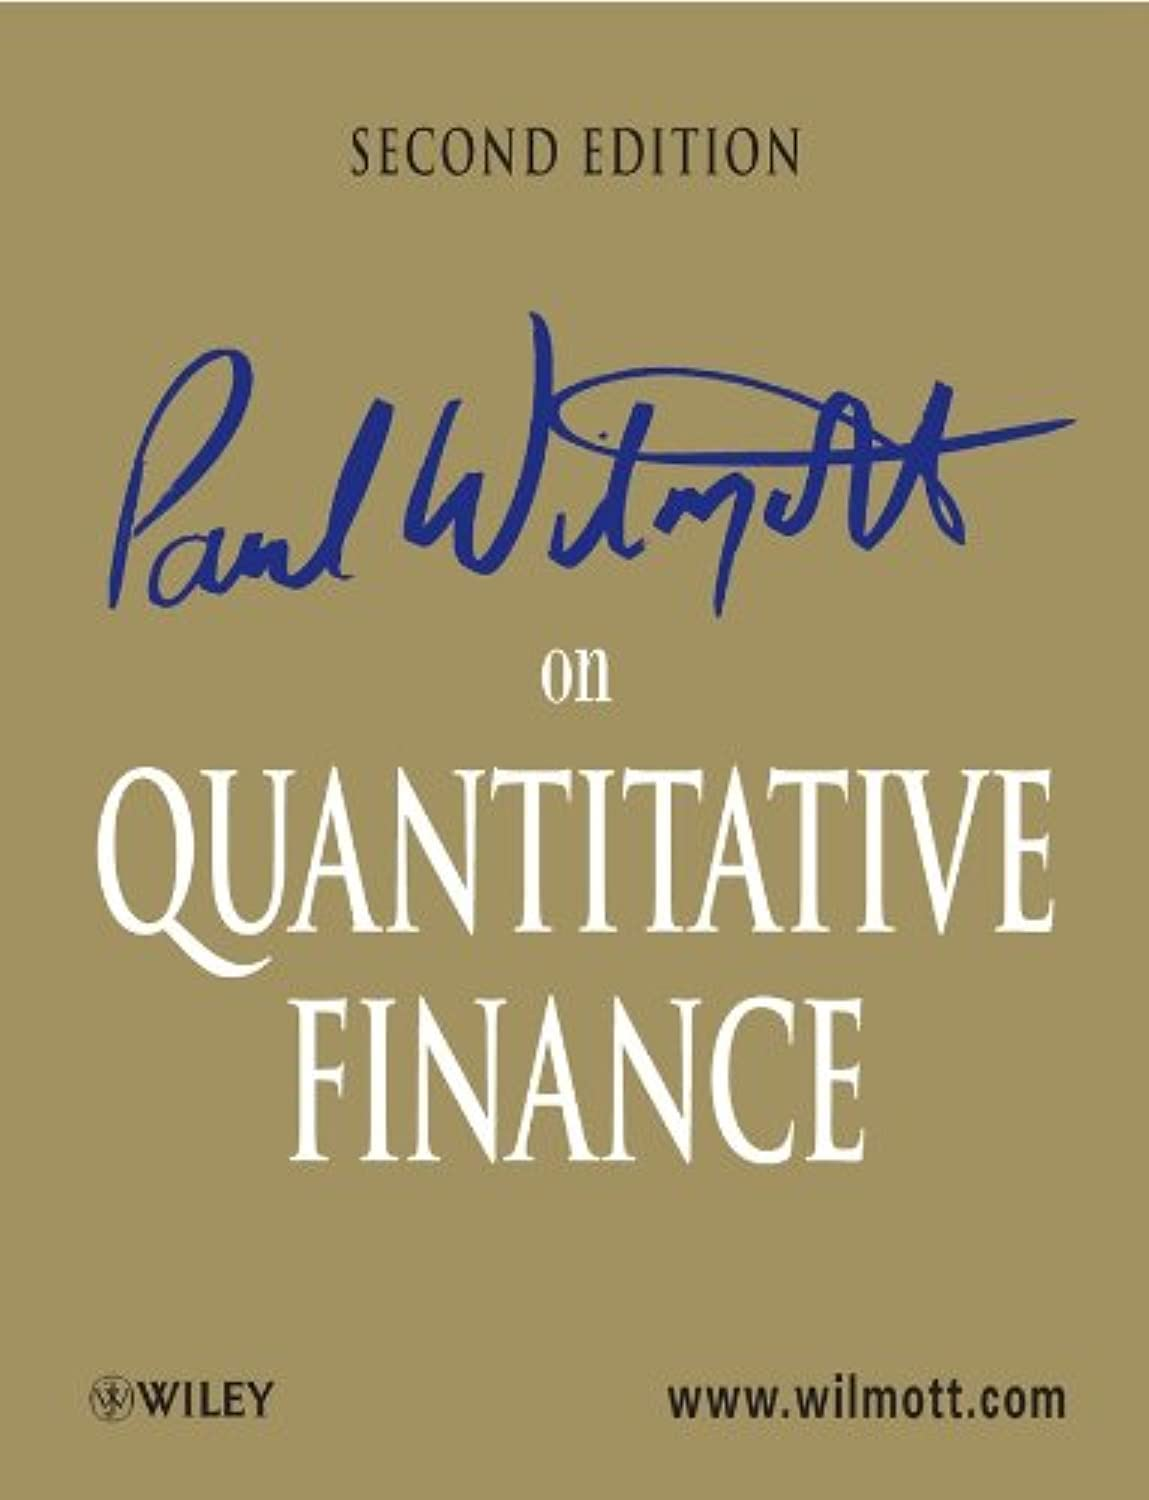
There is evidence, and lots of it, that tails of returns distributions are fat.
The empirical peak is higher than the normal distribution and the tails are both fatter.
Probability of a 20% SPX fall: empirical
Since we working with 24 years of daily data, we could argue that empirically the probability of a 20% fall in the SPX is one in 24 * 252, or 0.000165.
Probability of a 20% SPX fall: theoretical
To get a theoretical estimate, based on normal distributions, we must first estimate the daily standard deviation for SPX returns. Over that period it was 0.0106, equivalent to an average volatility of 16.9%. Theoretical answer: once very \(2 \times 10^{76}\) years. That’s how bad the normal-distribution assumption is in the tails.
Use a different distribution, perhaps
Serial autocorrelation
Another reason why the normal distribution might not be relevant is if there is any serial autocorrelation in stock price returns from trade to trade, or day to day. Serial autocorrelation means the correlation between the return one day and the return the previous day.
Again there is evidence that there is such autocorrelation, perhaps not that strong on average, but over certain periods, especially intra day, the effect is enough to scupper the normal distribution.
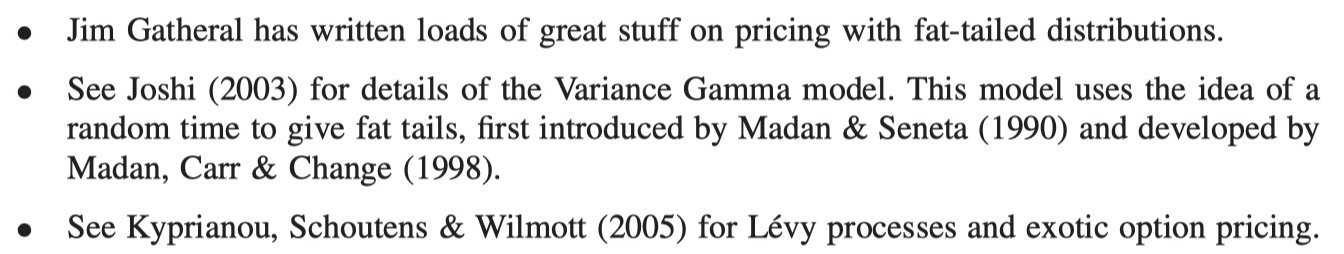
Further reading